OS Statistics
SolarNode can collect operating system metrics such as uptime and CPU temperature.
This components is included in the solarnode-app-osstat package in SolarNodeOS. You can install this package on the System > Packages page in SolarNode.
Use
Once installed, a new OS Statistics component will appear on the Settings > Components page on your SolarNode. Click on the Manage button to configure components.

Settings
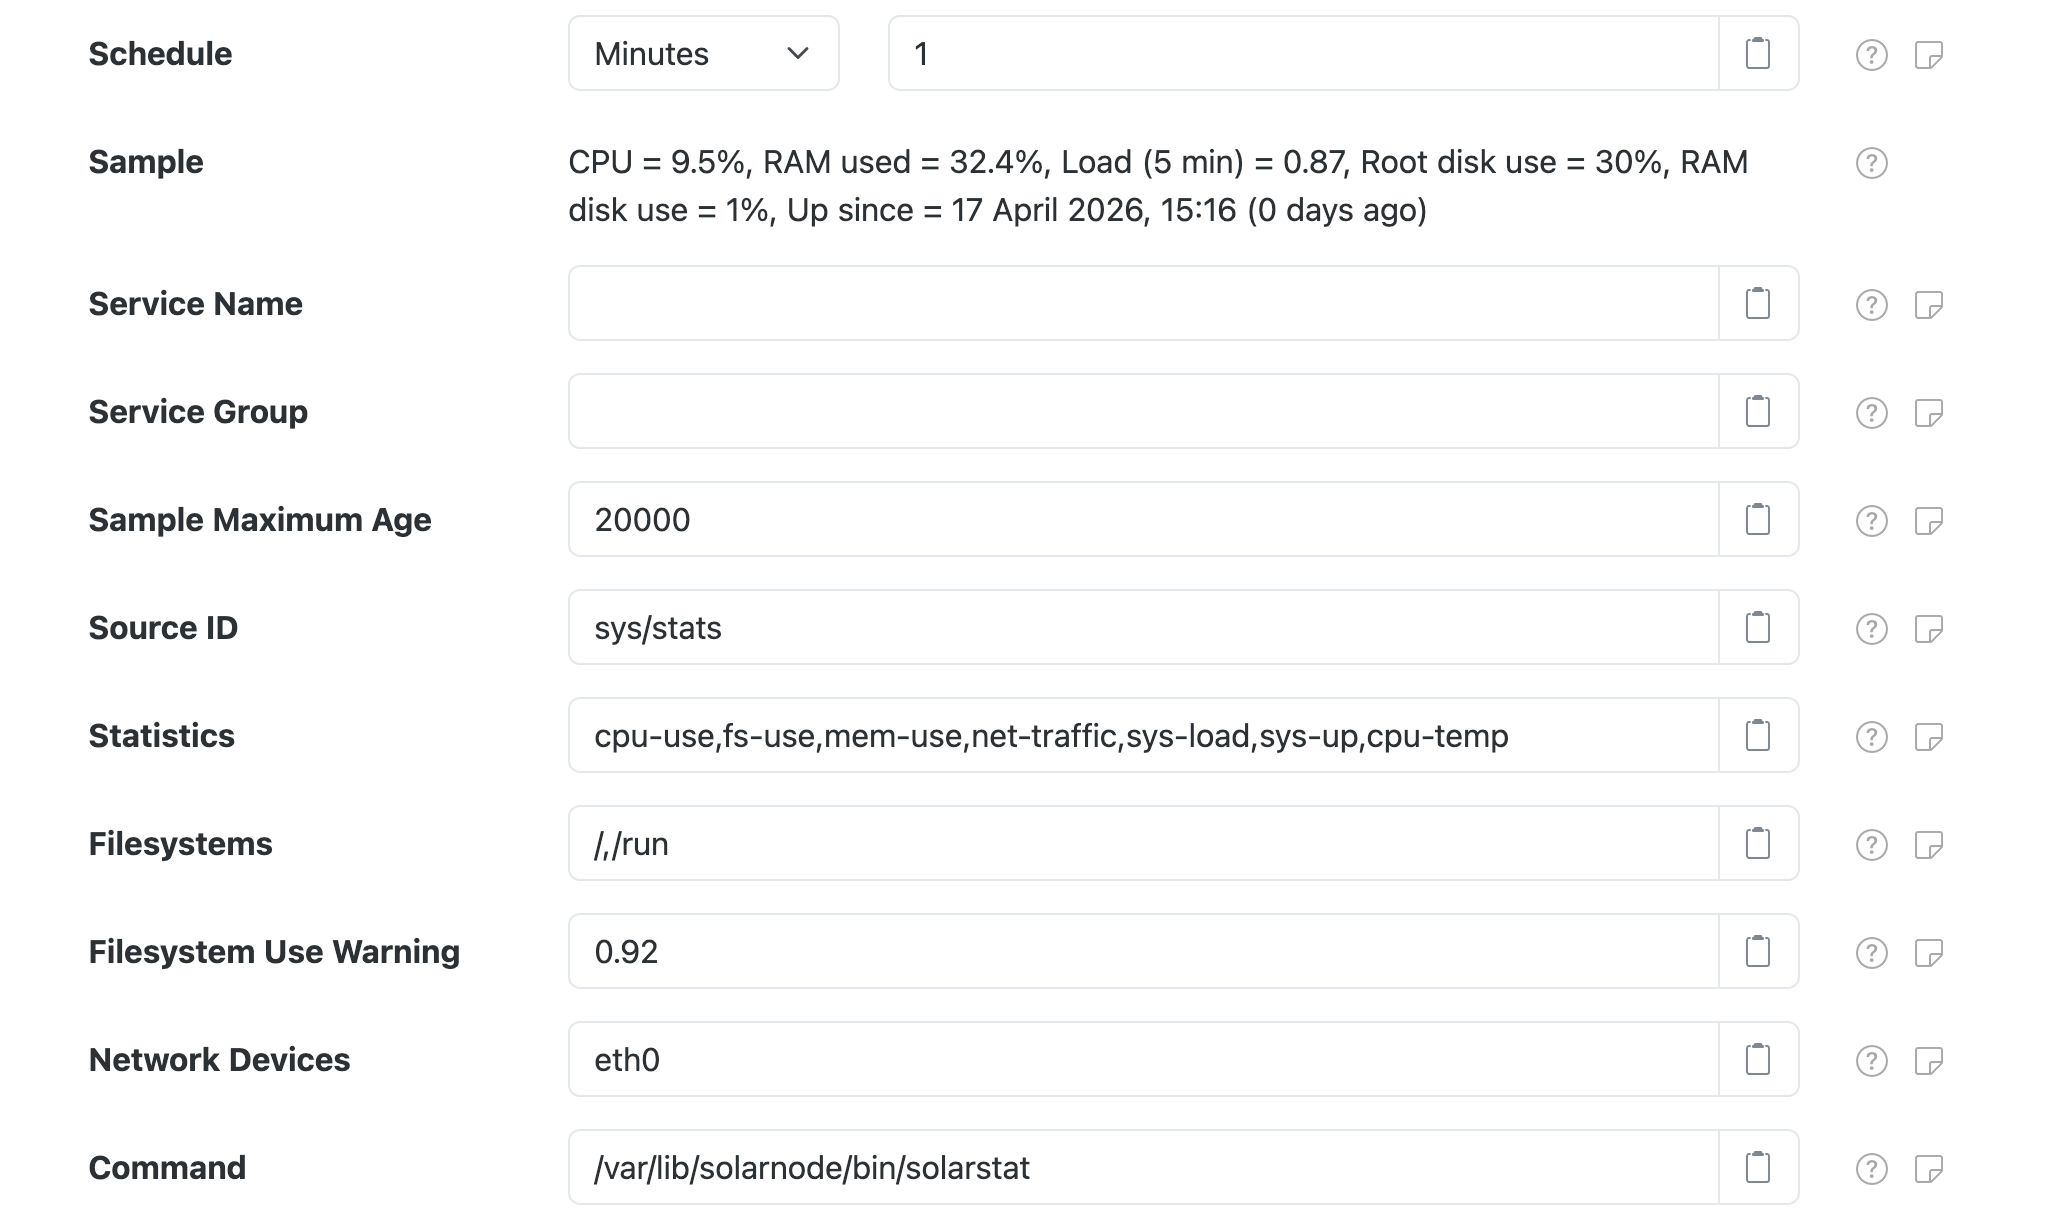
Each configuration contains the following overall settings:
| Setting | Description |
|---|---|
| Schedule | A cron schedule that determines when data is collected. |
| Service Name | A unique name to identify this data source with. |
| Service Group | A group name to associate this data source with. |
| Sample Maximum Age | A minimum time to cache captured Modbus data, in milliseconds. |
| Source ID | The SolarNetwork source ID to assign to captured datum. This value unique identifies the data collected from this device, by this node, on SolarNetwork. Each configured device should use a different value. |
| Statistics | A list of statistic types to collect. See Statistic types for the most commonly supported types. |
| Filesystems | A list of filesystem paths to collect statistics from. |
| Network Devices | A list of network device names to collect statistics from. |
| Command | The external command to execute that provides the statistic data. |
Node metadata
This plugin will publish some OS information as node metadata, under the os property
metadata key. The metadata is:
| Key | Description |
|---|---|
os.arch |
The OS architecture. |
os.name |
The OS name. |
os.version |
The OS version. |
For example:
{
    "pm": {
        "os": {
            "name": "Linux",
            "arch": "arm",
            "version": "4.14.34-v7+"
        }
    }
}
Example datum
Here's an example datum collected by this plugin:
{
    "created": "2018-08-13 18:25:21.014Z",
    "nodeId": 344,
    "sourceId": "OS Stats",
    "localDate": "2018-08-14",
    "localTime": "06:25",
    "cpu_idle": 98.27,
    "cpu_user": 1.59,
    "cpu_system": 0.13,
    "fs_size_/": 1887322112,
    "fs_used_/": 793722880,
    "fs_used_percent_/": 45,
    "fs_size_/run": 512094208,
    "fs_used_/run": 15802368,
    "fs_used_percent_/run": 4,
    "sys_load_1min": 0.35,
    "sys_load_5min": 0.14,
    "sys_load_15min": 0.11,
    "ram_avail": 743899136,
    "ram_total": 1024188416,
    "ram_used_percent": 27.4,
    "sys_up": 2923.77,
    "net_bytes_in_eth0": 528719,
    "net_bytes_out_eth0": 459475,
    "net_packets_in_eth0": 2312,
    "net_packets_out_eth0": 1848
}
Statistic types
The external helper command must support the following statistic types and return data in the following formats. The output must always include a header row before any data rows. Extra columns are allowed; they will simply be ignored.
cpu-temp
The CPU temperature, in degrees celsius. This is not available on all systems, but is fairly common. It is implemented as a custom statistic on platforms that do support it.
| Column | Property | Description |
|---|---|---|
| i/cpu_temp | cpu_temp |
The CPU temperature, in degrees celsius. |
An example output looks like:
i/cpu_temp
45.277
cpu-use
Average CPU utilization information, inspired by sysstat. Any number of rows of data may
be returned, but only the last row of data may be used.
| Column | Property | Description |
|---|---|---|
| user | cpu_user |
Percentage of CPU time in user programs, from 0-100. |
| system | cpu_system |
Percentage of CPU time in the kernel, from 0-100. |
| idle | cpu_idle |
Percentage of idle CPU time, from 0-100. |
An example output looks like:
user,system,idle
0.03,0.03,99.93
fs-use
Filesystem utilization information. Each row represents a single mount point. Each
property has the mount point appended to the end. For example the root mount point /
would have a percentage used property named fs_used_percent_/.
| Column | Property | Description |
|---|---|---|
| mount | Used in other property names. | |
| size-kb | fs_size_{mount} |
Size of filesystem, in kilobytes. Property stored as bytes. |
| used-kb | fs_used_{mount} |
Allocated use of filesystem, in kilobytes. Property stored as bytes. |
| used-percent | fs_used_percent_{mount} |
Percentage of filesystem used, from 0-100. |
An example output looks like:
mount,size-kb,used-kb,used-percent
/dev,2003748,0,0
/run,403224,12268,4
/,19880876,12383500,66
/boot,233191,36370,17
mem-use
RAM utilization information.
| Column | Property | Description |
|---|---|---|
| total-kb | ram_total |
Amount of RAM installed in the system, in kilobytes. Property stored as bytes. |
| avail-kb | ram_avail |
Amount of unused RAM avaialble, in kilobytes. Property stored as bytes. |
ram_used_percent |
Percentage of RAM used, from 0-100. Derived from ram_total and ram_avail. |
An example output looks like:
total-kb,avail-kb
33554432,9505456
net-traffic
Network use information. Each row represents a single network device. Each
property has the device name appended to the end. For example the WiFi device
wlan0 would have a bytes out property named net_bytes_out_wlan0.
| Column | Property | Description |
|---|---|---|
| name | Used in other property names. | |
| bytes-in | net_bytes_in_{name} |
Count of bytes receivied. |
| bytes-out | net_bytes_out_{name} |
Count of bytes sent. |
| packets-in | net_packets_out_{name} |
Count of packets received. |
| packets-out | net_packets_out_{name} |
Count of packets sent. |
device,bytes-in,bytes-out,packets-in,packets-out
wlan0,9161,5970,86,38
lo,1242,1242,12,12
eth0,9348,10031,80,81
usb0,0,0,0,0
sys-load
System load information.
| Column | Property | Description |
|---|---|---|
| 1min | sys_load_1min |
Average load over past minute. |
| 5min | sys_load_5min |
Average load over past 5 minutes. |
| 15min | sys_load_15min |
Average load over past 15 minutes. |
An example output looks like:
1min,5min,15min
0.09,0.10,0.07
sys-up
System uptime information.
| Column | Property | Description |
|---|---|---|
| up-sec | sys_up |
Number of seconds the system has been running. |
An example output looks like:
up-sec
26483.63
Custom statistic types
This plugin supports custom statistic collection via arbitrary statistic
names. The configured Command must support the statistic names, of course, and they must return
CSV formatted data, including a header row. All returned columns will be populated as status datum
properties. To populate instantaneous or accumulating properties, the column names should be
prefixed with i/ and a/, respectively. The actual property name used on the datum will be
stripped of this prefix. For example, if the Command supports a cpu-temp statistic that should
populate an instantaneous property cpu_temp the output should be formatted like this:
i/cpu_temp
30.1